OCTOBER 2018
A wide field imaging exercise – the Cygnus region.
An article in the author’s Astronomy Digest – https://www.ianmorison.com
This is a work through of the processing of a number of 30 second exposures taken with a Sony A5000 camera and 50 mm prime lens stopped down to f/3.5 using an ISO of 800. [The article ‘What ISO to use for Astrophotography’ would be worth reading and there is also an article about the Sony A5000.]
The camera was mounted on a Nanotracker tracking mount as seen in the article about the A5000 and the frame was aligned along the Milky Way to the north of Sadir and Deneb in Cygnus. [The Nanotracker is described in the article about tracking mounts. I do slightly miss-align on the North Celestial Pole so that the image moves very slowly across the sensor to remove what is called ‘colour mottling.]
Conversion of the Sony raw files to .tif files
The raw file has to be ‘de-Bayered’ to give a colour image and raw conversion programs may well produce a better result than that achieved by using the de-Bayer routine employed in Deep Sky Stacker. I thus converted the raw files to .tif files using the Sony raw converter (now called ‘Imaging Edge’).
Aligning and Stacking in Deep Sky Stacker (DSS)
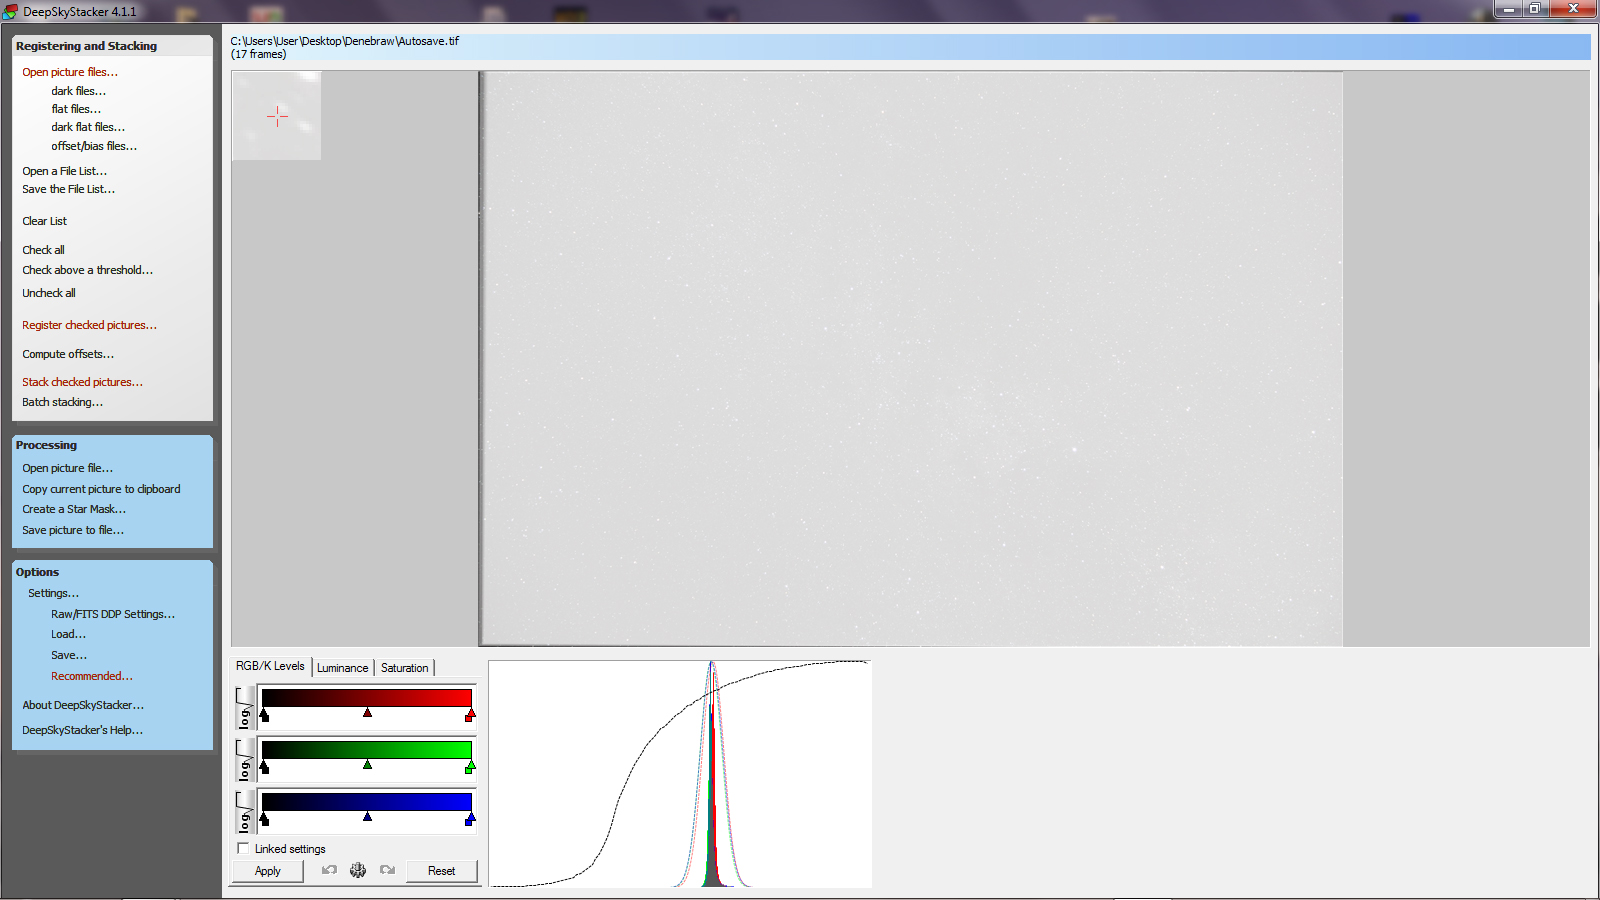
The set of .tif files were loaded into DSS and the star detection threshold adjusted so that ~150 stars were detected.
This was the first set of images that I have processed since the sodium street lamps in the area where I live have been replaced by LED lamps. The overall brightness around my house is certainly less. DSS gives red, green and blue histograms below the stacked image where, up until now, there has always been a red peak over to the right of the green and blue − the result of the light pollution. As seen in the screen shot below, all three peaks were aligned so that the light pollution that remained was ‘white’, not orange, as now would be expected (but how bright I cannot tell).
Stretching the image in FITS Liberator 3
Not surprisingly, FITS Liberator 3 requires a .fit file to process. To produce this, the .tif file output from DSS was loaded into the free program IRIS and, having done nothing, saved as a .fit file. This was loaded into FITS Liberator 3. The way this is used to provide a stretched colour image is described in some detail in the article ‘Wide-Field Imaging…..’.
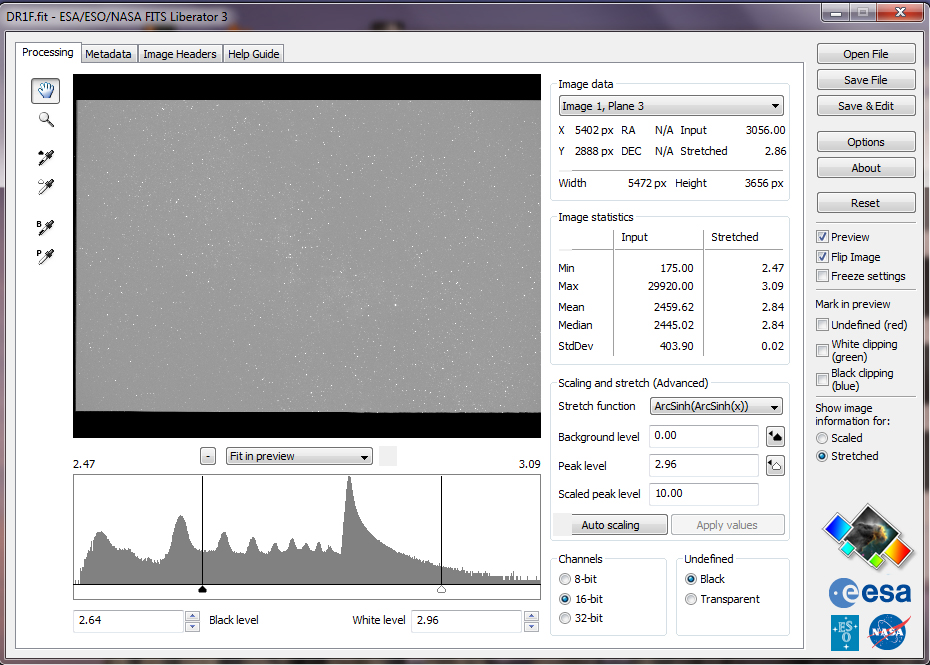
Stretching Plane 3 – the blue image – using the stretching function shown.
However for this exercise, I applied an additional processing step. The program produces red, green and blue grey scale images. All were quite bright (as can be seen in the screen shot above), and a look at their histograms in the ‘Levels’ command showed a sharp peak in the centre of the histogram. In each case I therefore moved the left hand slider over to the left edge of the peak to reset the ‘black point’ of the images. These were then used to produce a colour image as described in the article.
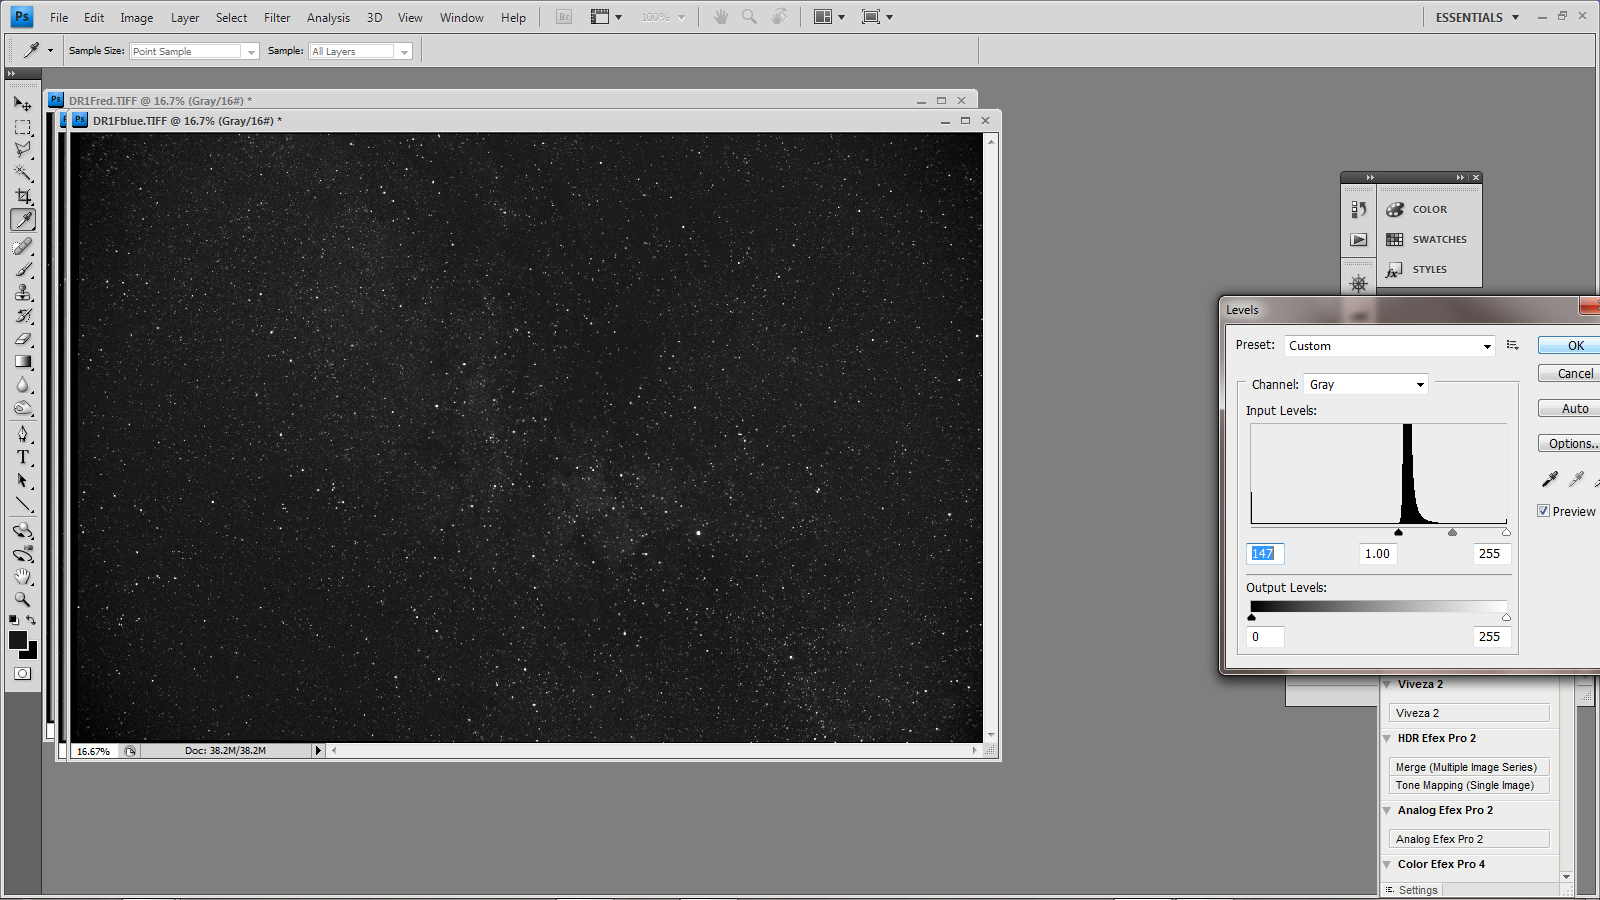
The black point was set for each of the monochrome RGB images.
Enhancing the image in Adobe Photoshop
The image was quite dark, so an additional stretching step was made using the levels command: the central slider was moved over to the left to the 1.2 position, and the left hand slider a little to the right to reset the black point. The local contrast was increased using the ‘Unsharp Mask’ filter to highlight the separation between the dark dust lanes and brighter parts of the Milky Way; the range was set to maximum (250 pixels) and the amount increased up to ~20% observing the result and selecting a value to suit.
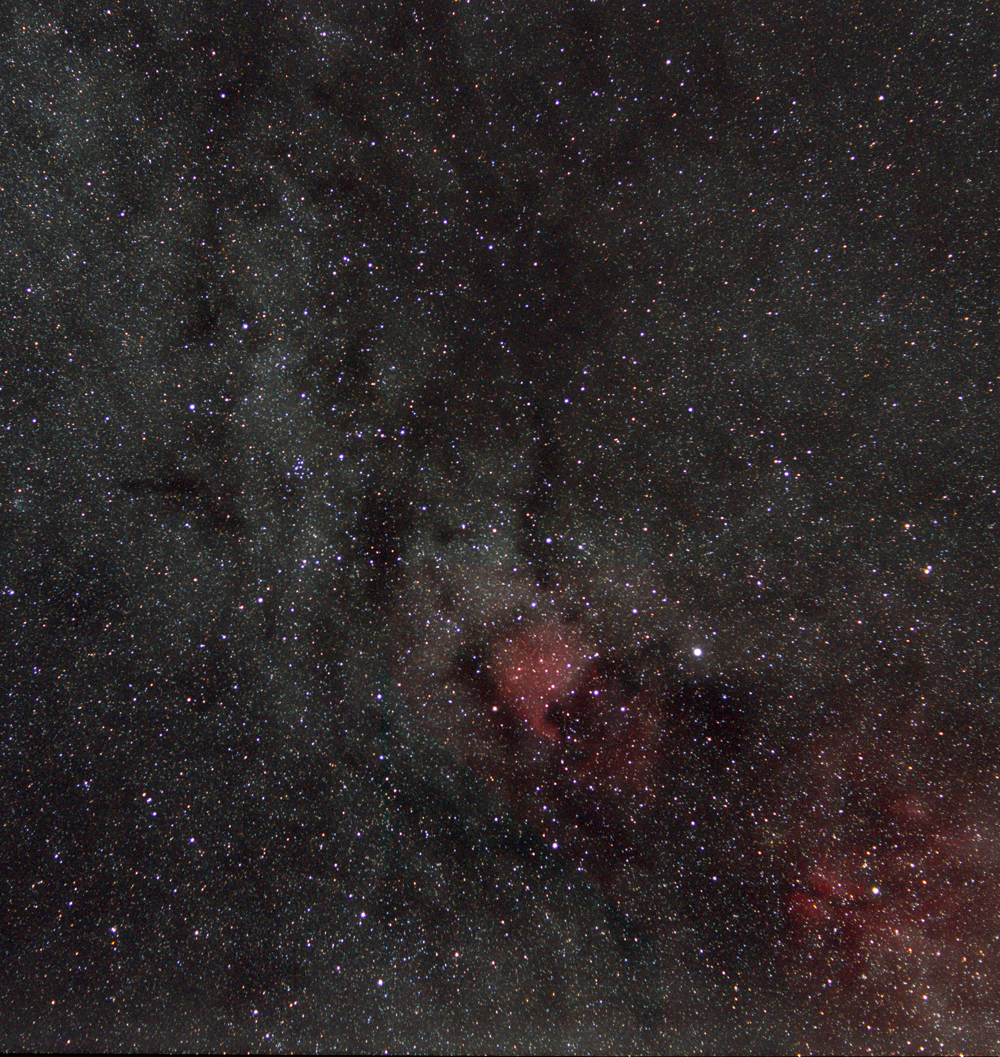
[The images below have been cropped to make the most interesting region of the whole image more prominent.]
For the first time, I applied a further step. Applying the ‘Noise and Scratches’ filter with a radius of ~20 pixels to the image removes the stars (it thinks that they are noise) and gave a rather nice delineation between the dark dust lanes and brighter regions. I thus changed the mode to monochrome, then back to RGB colour before saving as a separate monochrome image.
This image was overlain over the image from which it was derived; (Open the monochrome image, ‘select all’ and copy (Ctrl A, Ctrl C). Open the original image and paste (Ctrl V) the new monochrome layer over it.) The layer blending mode was set to ‘Lighten’ and the ‘opacity’ reduced to ~20% before flattening the two layers.
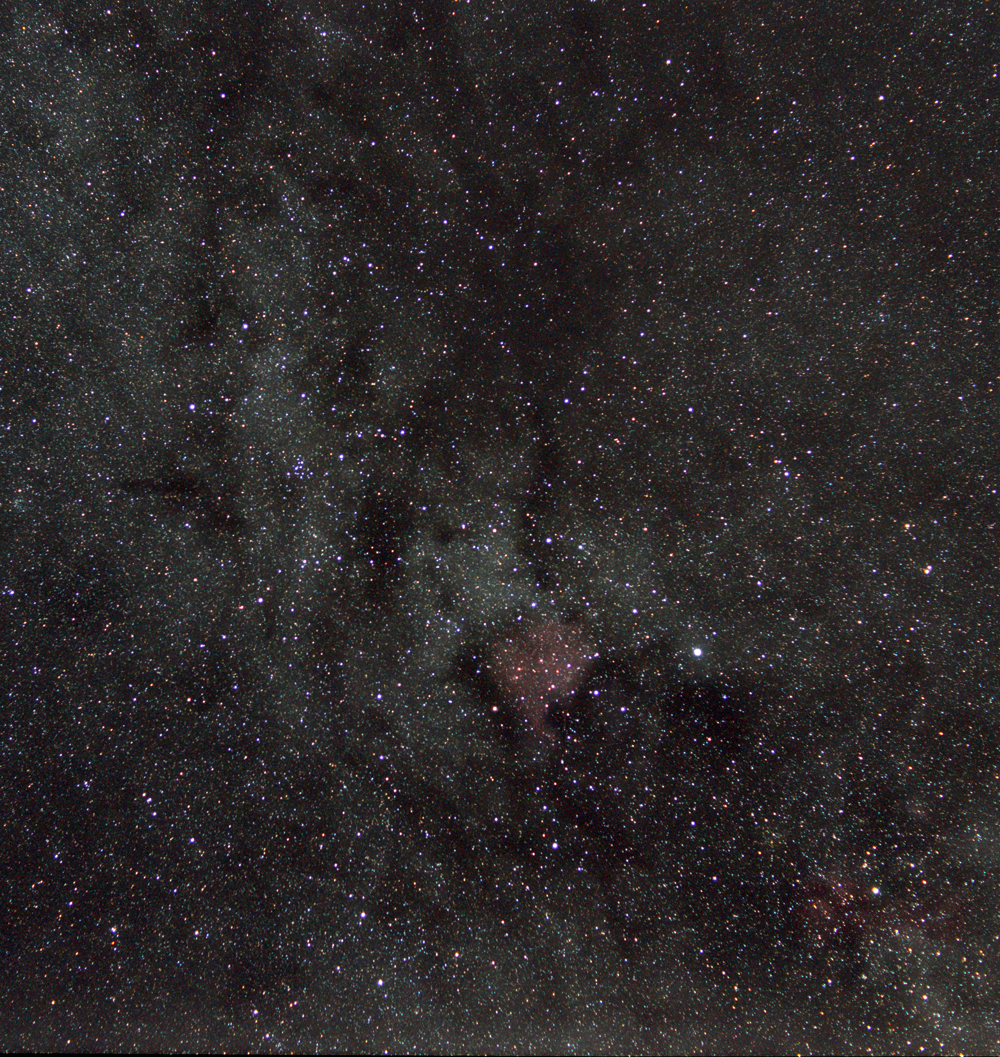
The image does show the North America Nebula close to Deneb with, up to its left, Messier 39. I had noticed a dark linear feature to the left of M39 and found that, using the wonderful ‘Interstellarium Deep Sky Atlas’, it is called the ‘Dark Cigar.
Adding an H-alpha Layer
I had previously taken an image of around the same scale using a monochrome CCD camera, 35 mm lens and H-alpha filter.
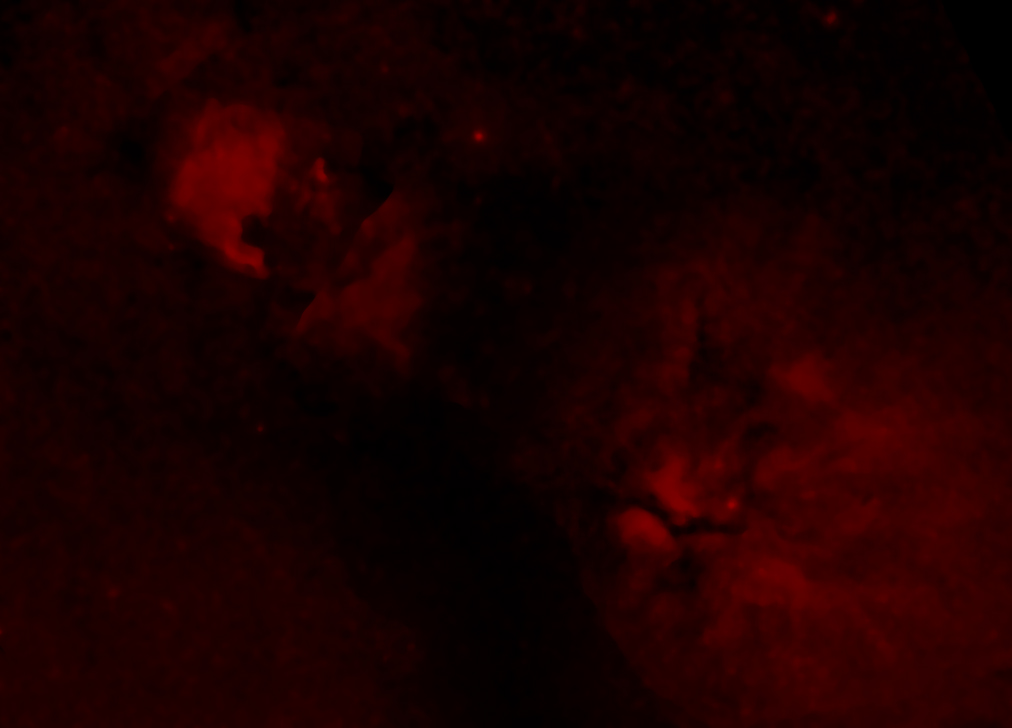
By aligning and scaling this image, I was able to add an H-alpha layer into image above by using the screen blending mode with an opacity of ~20%. The ‘Butterfly Nebula’ close to Sadr shows up and the North America Nebula becomes more prominent.